Every nursing home in America. One intelligent platform.
Search, map, and analyze skilled nursing facilities with 60+ CMS metrics, facility financials, side-by-side comparison, and ownership intelligence — in one fast workspace.
Then $25/mo · No contracts · Cancel anytime
14,700+
Facilities tracked
60+
CMS data metrics
50
States covered
$25/mo
One simple price
Facility research shouldn't take all day
Juggling CMS downloads, outdated spreadsheets, and hours of manual comparison? By the time you've gathered the data, the opportunity has moved on.
Scattered data sources
CMS downloads, cost reports, state databases, and industry reports all live in different places with different formats.
Hours of manual research
Comparing facilities means jumping between spreadsheets, PDFs, and outdated tools that weren't built for professionals.
Blind spots in ownership
Corporate structures, chain affiliations, and ownership changes are buried in filings most people never see.
Features
Everything you need for facility intelligence
Purpose-built tools for healthcare professionals who need answers, not more spreadsheets.
DATA TABLE
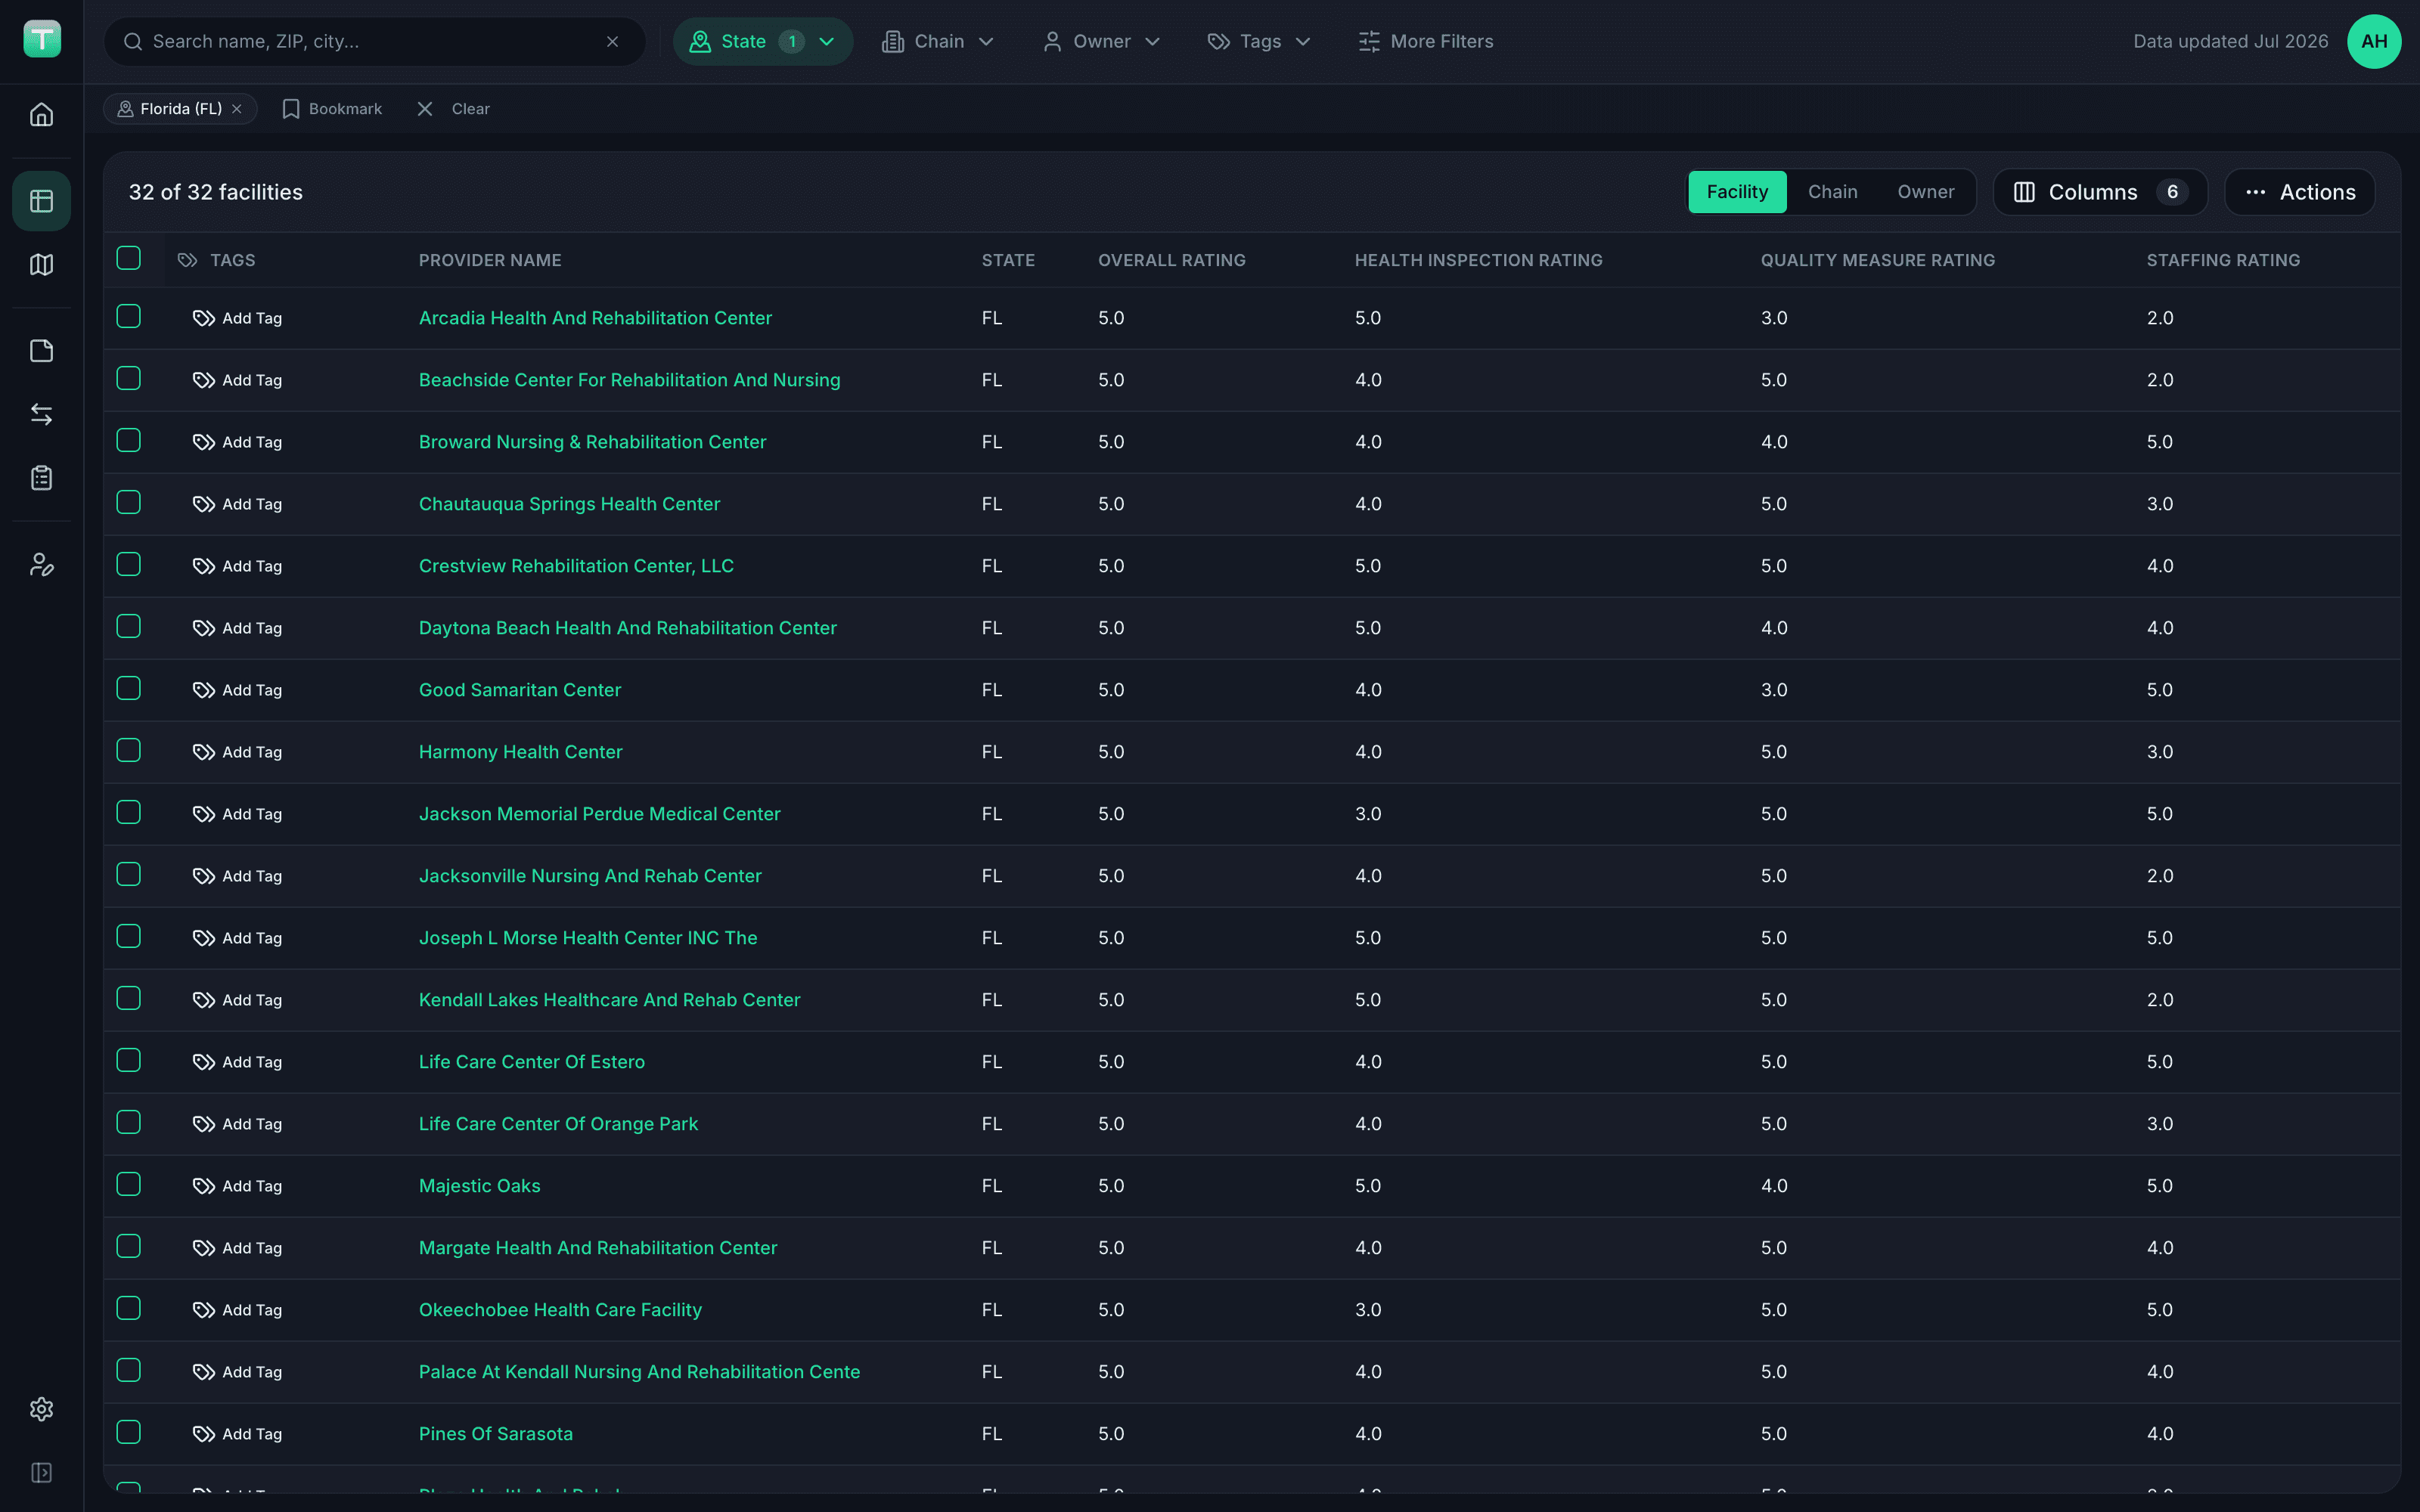
60+ metrics, one command center
Every facility in America in a fast, sortable table. Filter by state, chain, owner, or your own tags. Customize columns, pivot between facility, chain, and owner views, and export anything to CSV.
- Facility, chain, and owner-level views
- Custom column sets for your workflow
- One-click CSV export
SURVEY TAGS
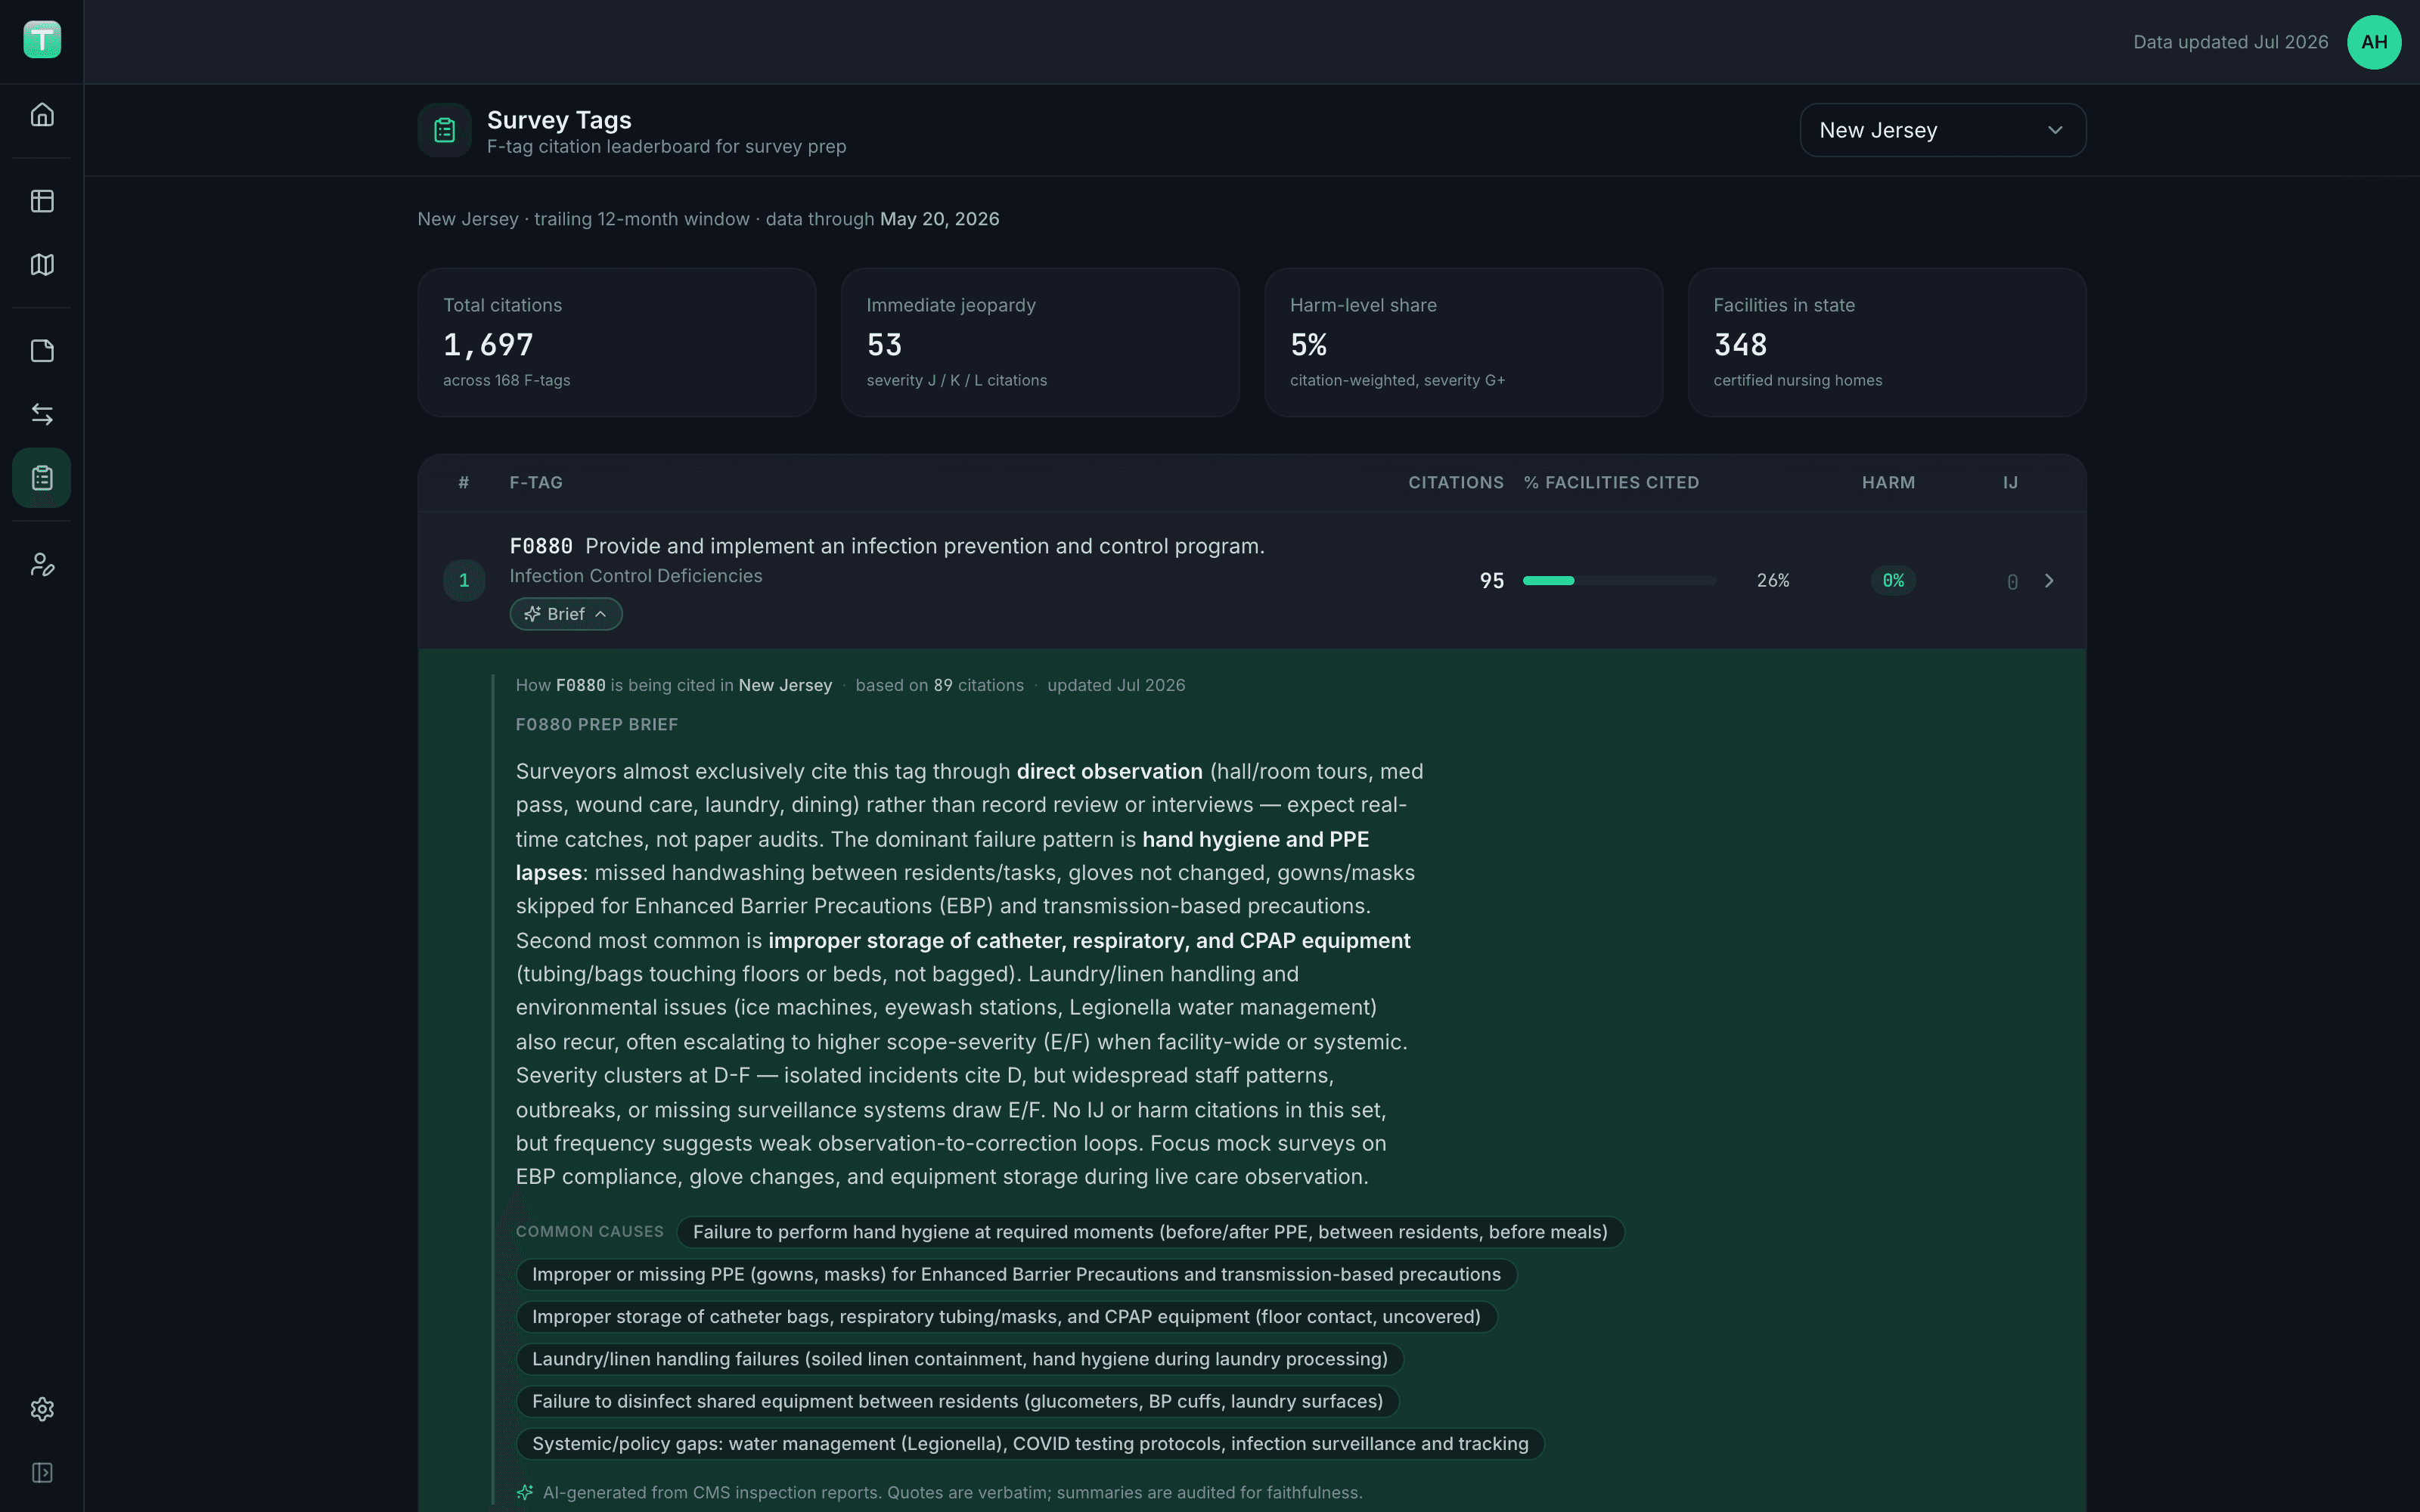
Know what surveyors cite before they walk in
A state-by-state leaderboard of the F-tags surveyors are actually citing, over a trailing 12-month window. Drill into any tag for the 50 most recent citations — then read the AI prep brief that distills how that tag is being cited in your state, straight from CMS inspection reports.
- State and national citation rankings for every F-tag
- Most recent citations per tag, linked to full inspection PDFs
- AI prep briefs with common causes — quotes verbatim, audited for faithfulness
Interactive mapping
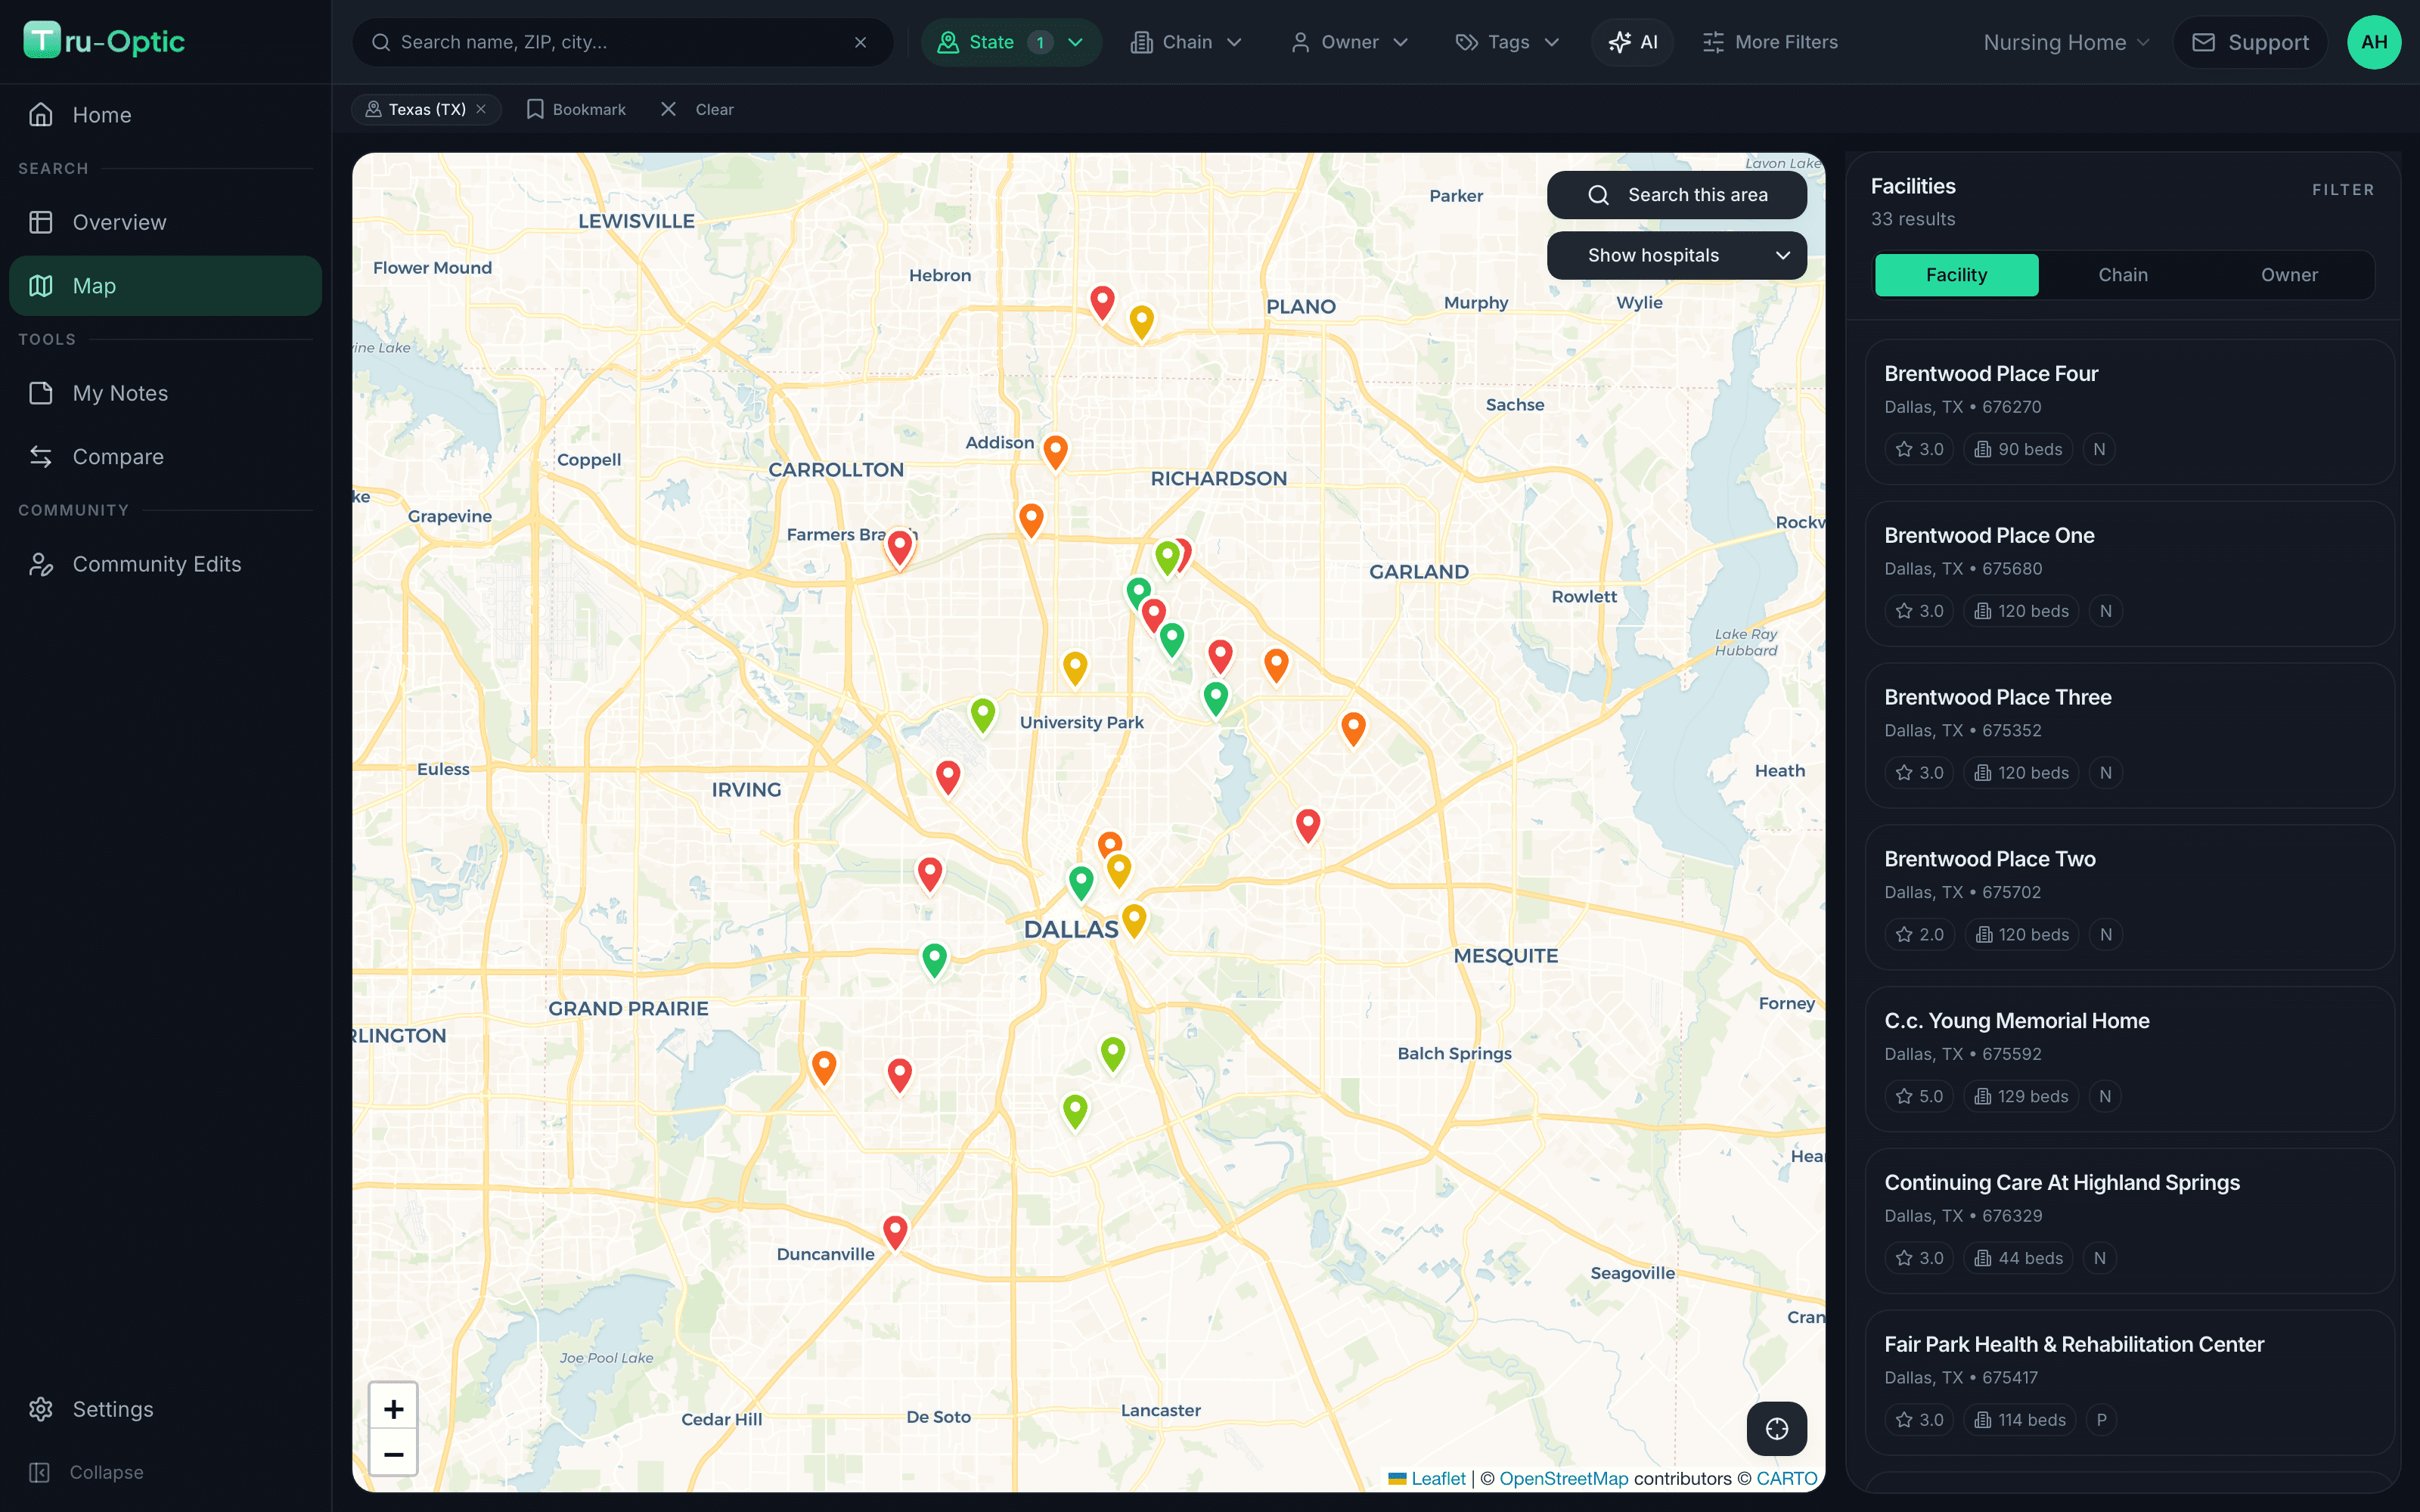
Color-coded rating pins, radius search, hospital overlays, and marker clustering. Find every facility near any location in seconds.
Learn more →Ownership & chain intelligence
Understand corporate structures, chain affiliations, and ownership changes across the entire SNF landscape. Know who owns what — and what changed.
Learn more →Custom tags
Tag facilities, owners, and chains with your own labels — “High Priority,” “Q3 Targets,” “Under Review” — and filter everything by them.
Private notes
Attach notes to any facility, owner, or chain. Record site-visit observations, flag concerns, document conversations — all in the right place.
Route optimizer
Visiting multiple facilities in one trip? The built-in route optimizer plans the most efficient driving order for your site visits.
News & compliance tracking
Facility profiles include news, deficiencies, penalties, staffing levels, and full inspection ratings — the whole picture in one place.
Financials
Follow the money on every facility
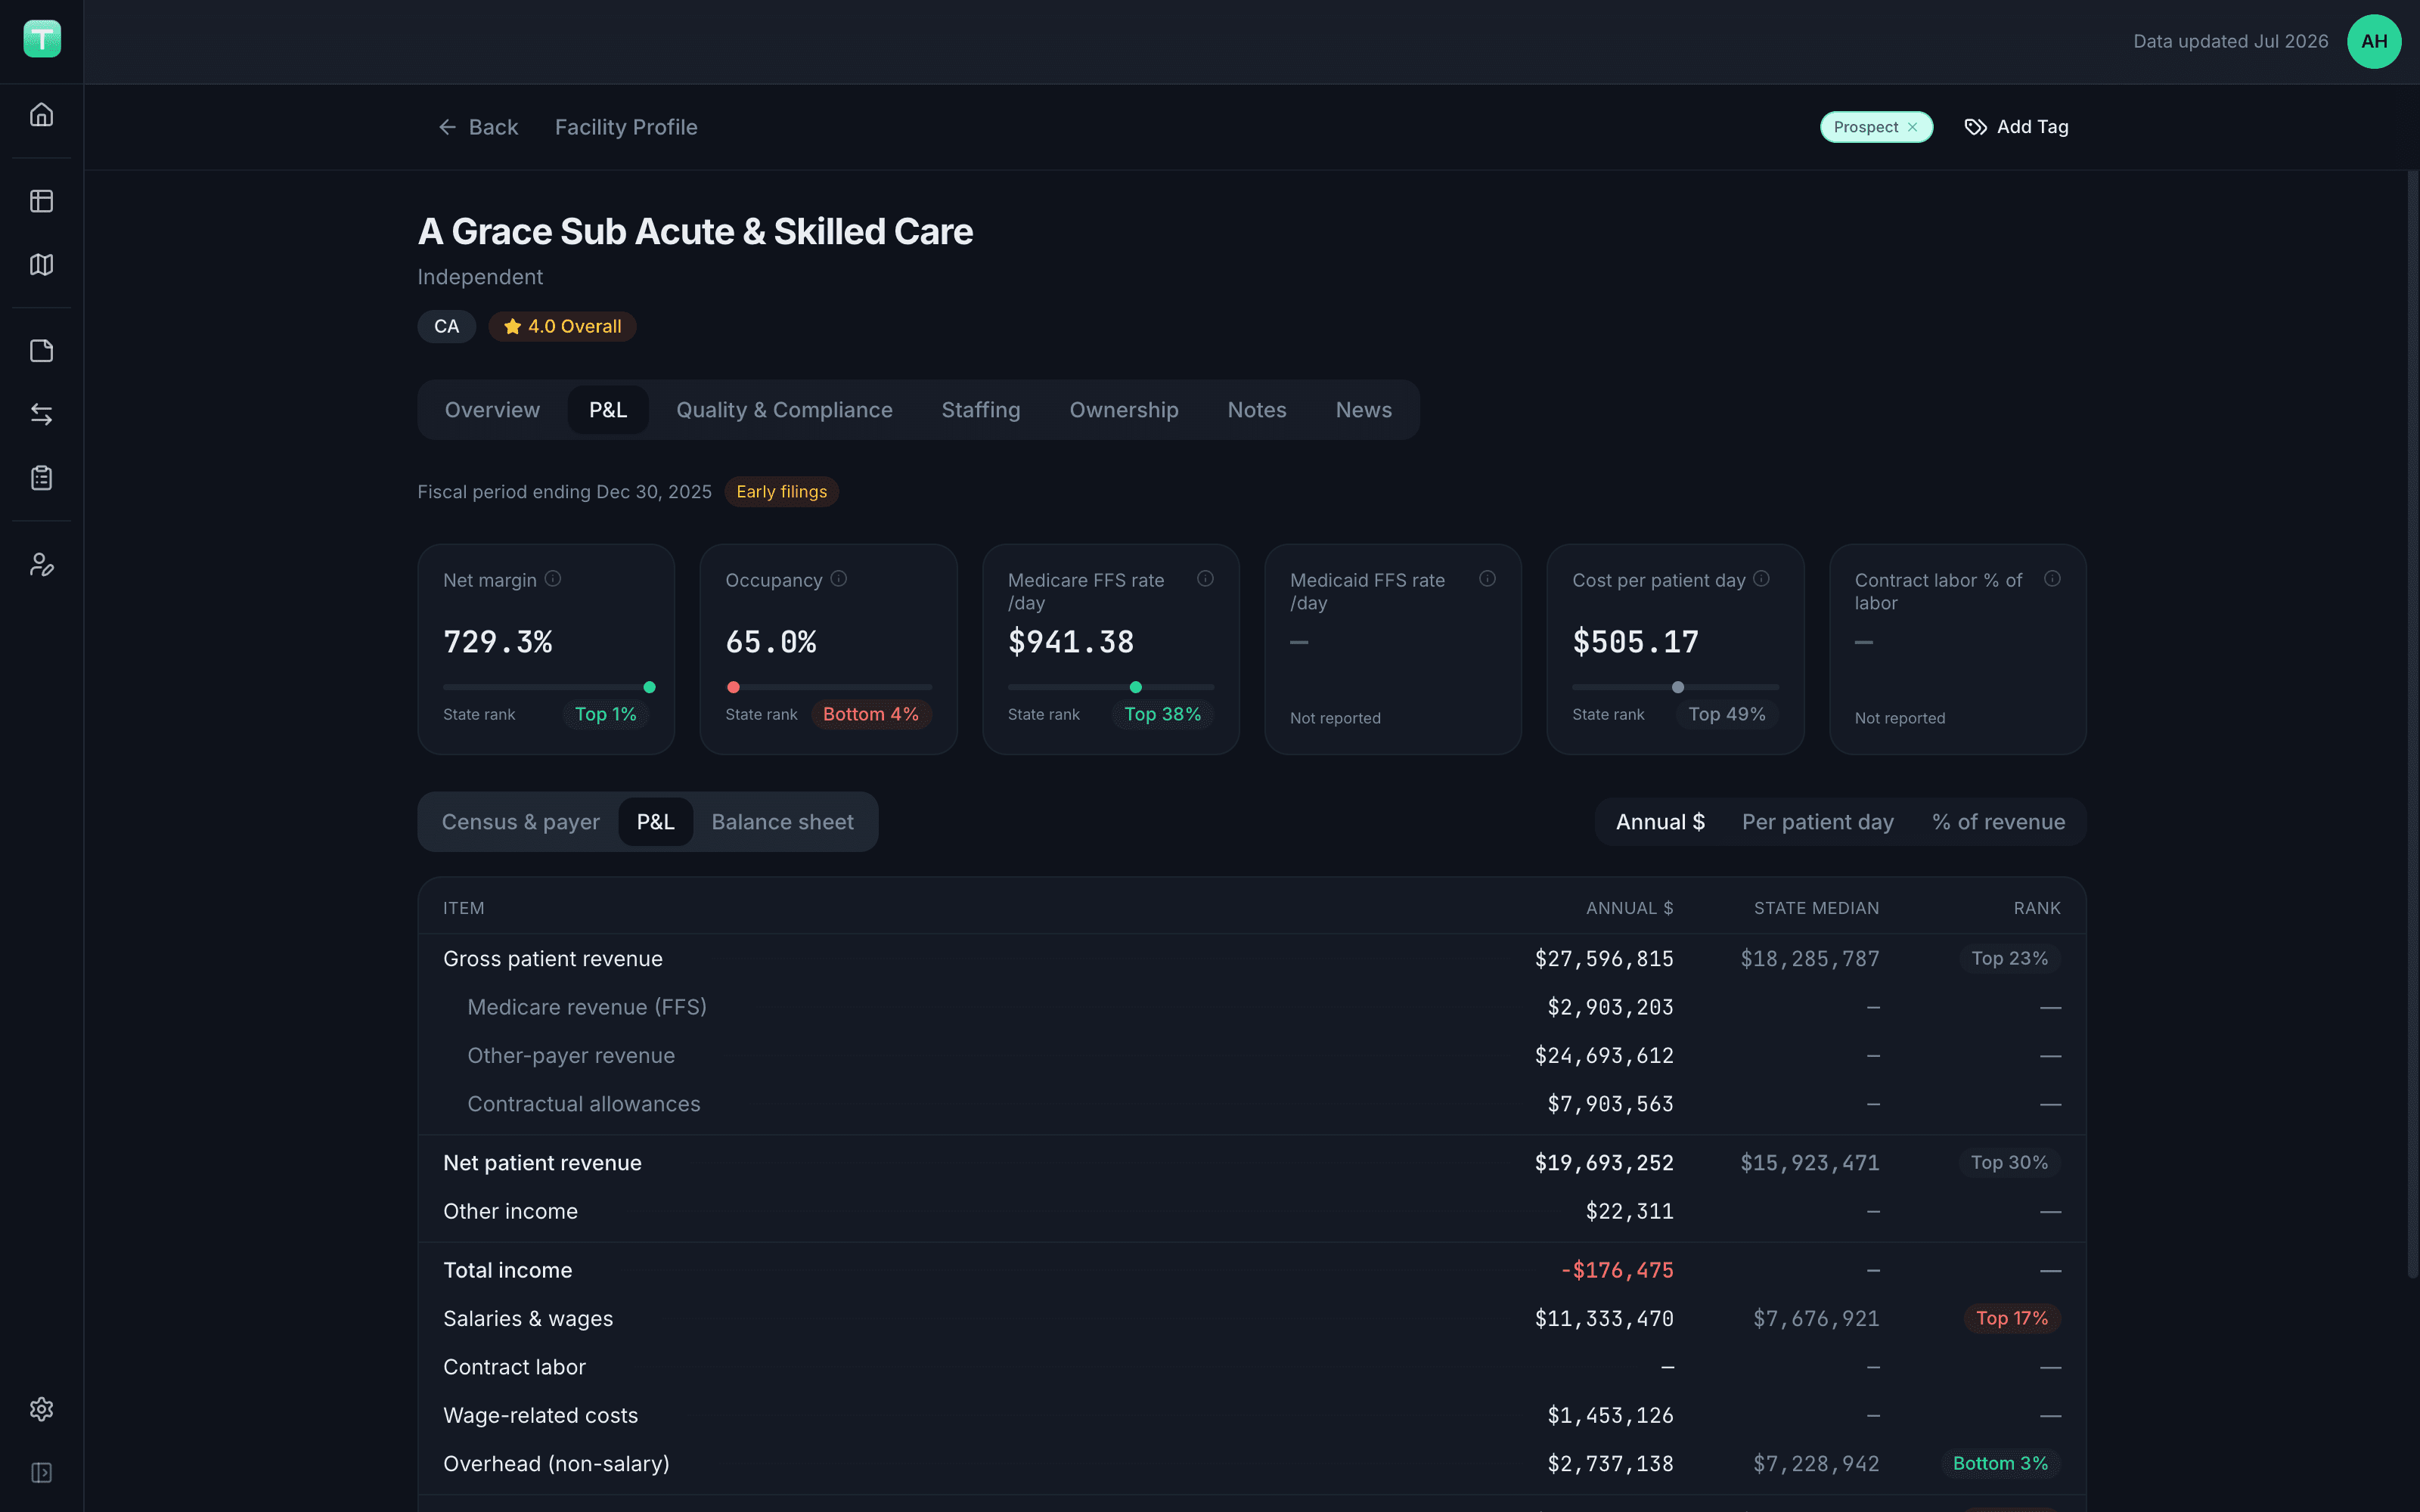
Full P&L for every facility, straight from cost report filings — revenue, payer rates, salaries, overhead, census — with every line benchmarked against the state median and ranked by percentile.
Net Patient Revenue
$19.7M
Medicare Rate / Day
$941.38
Cost / Patient Day
$505.17
vs. State Median
Top 30%
COMPARE
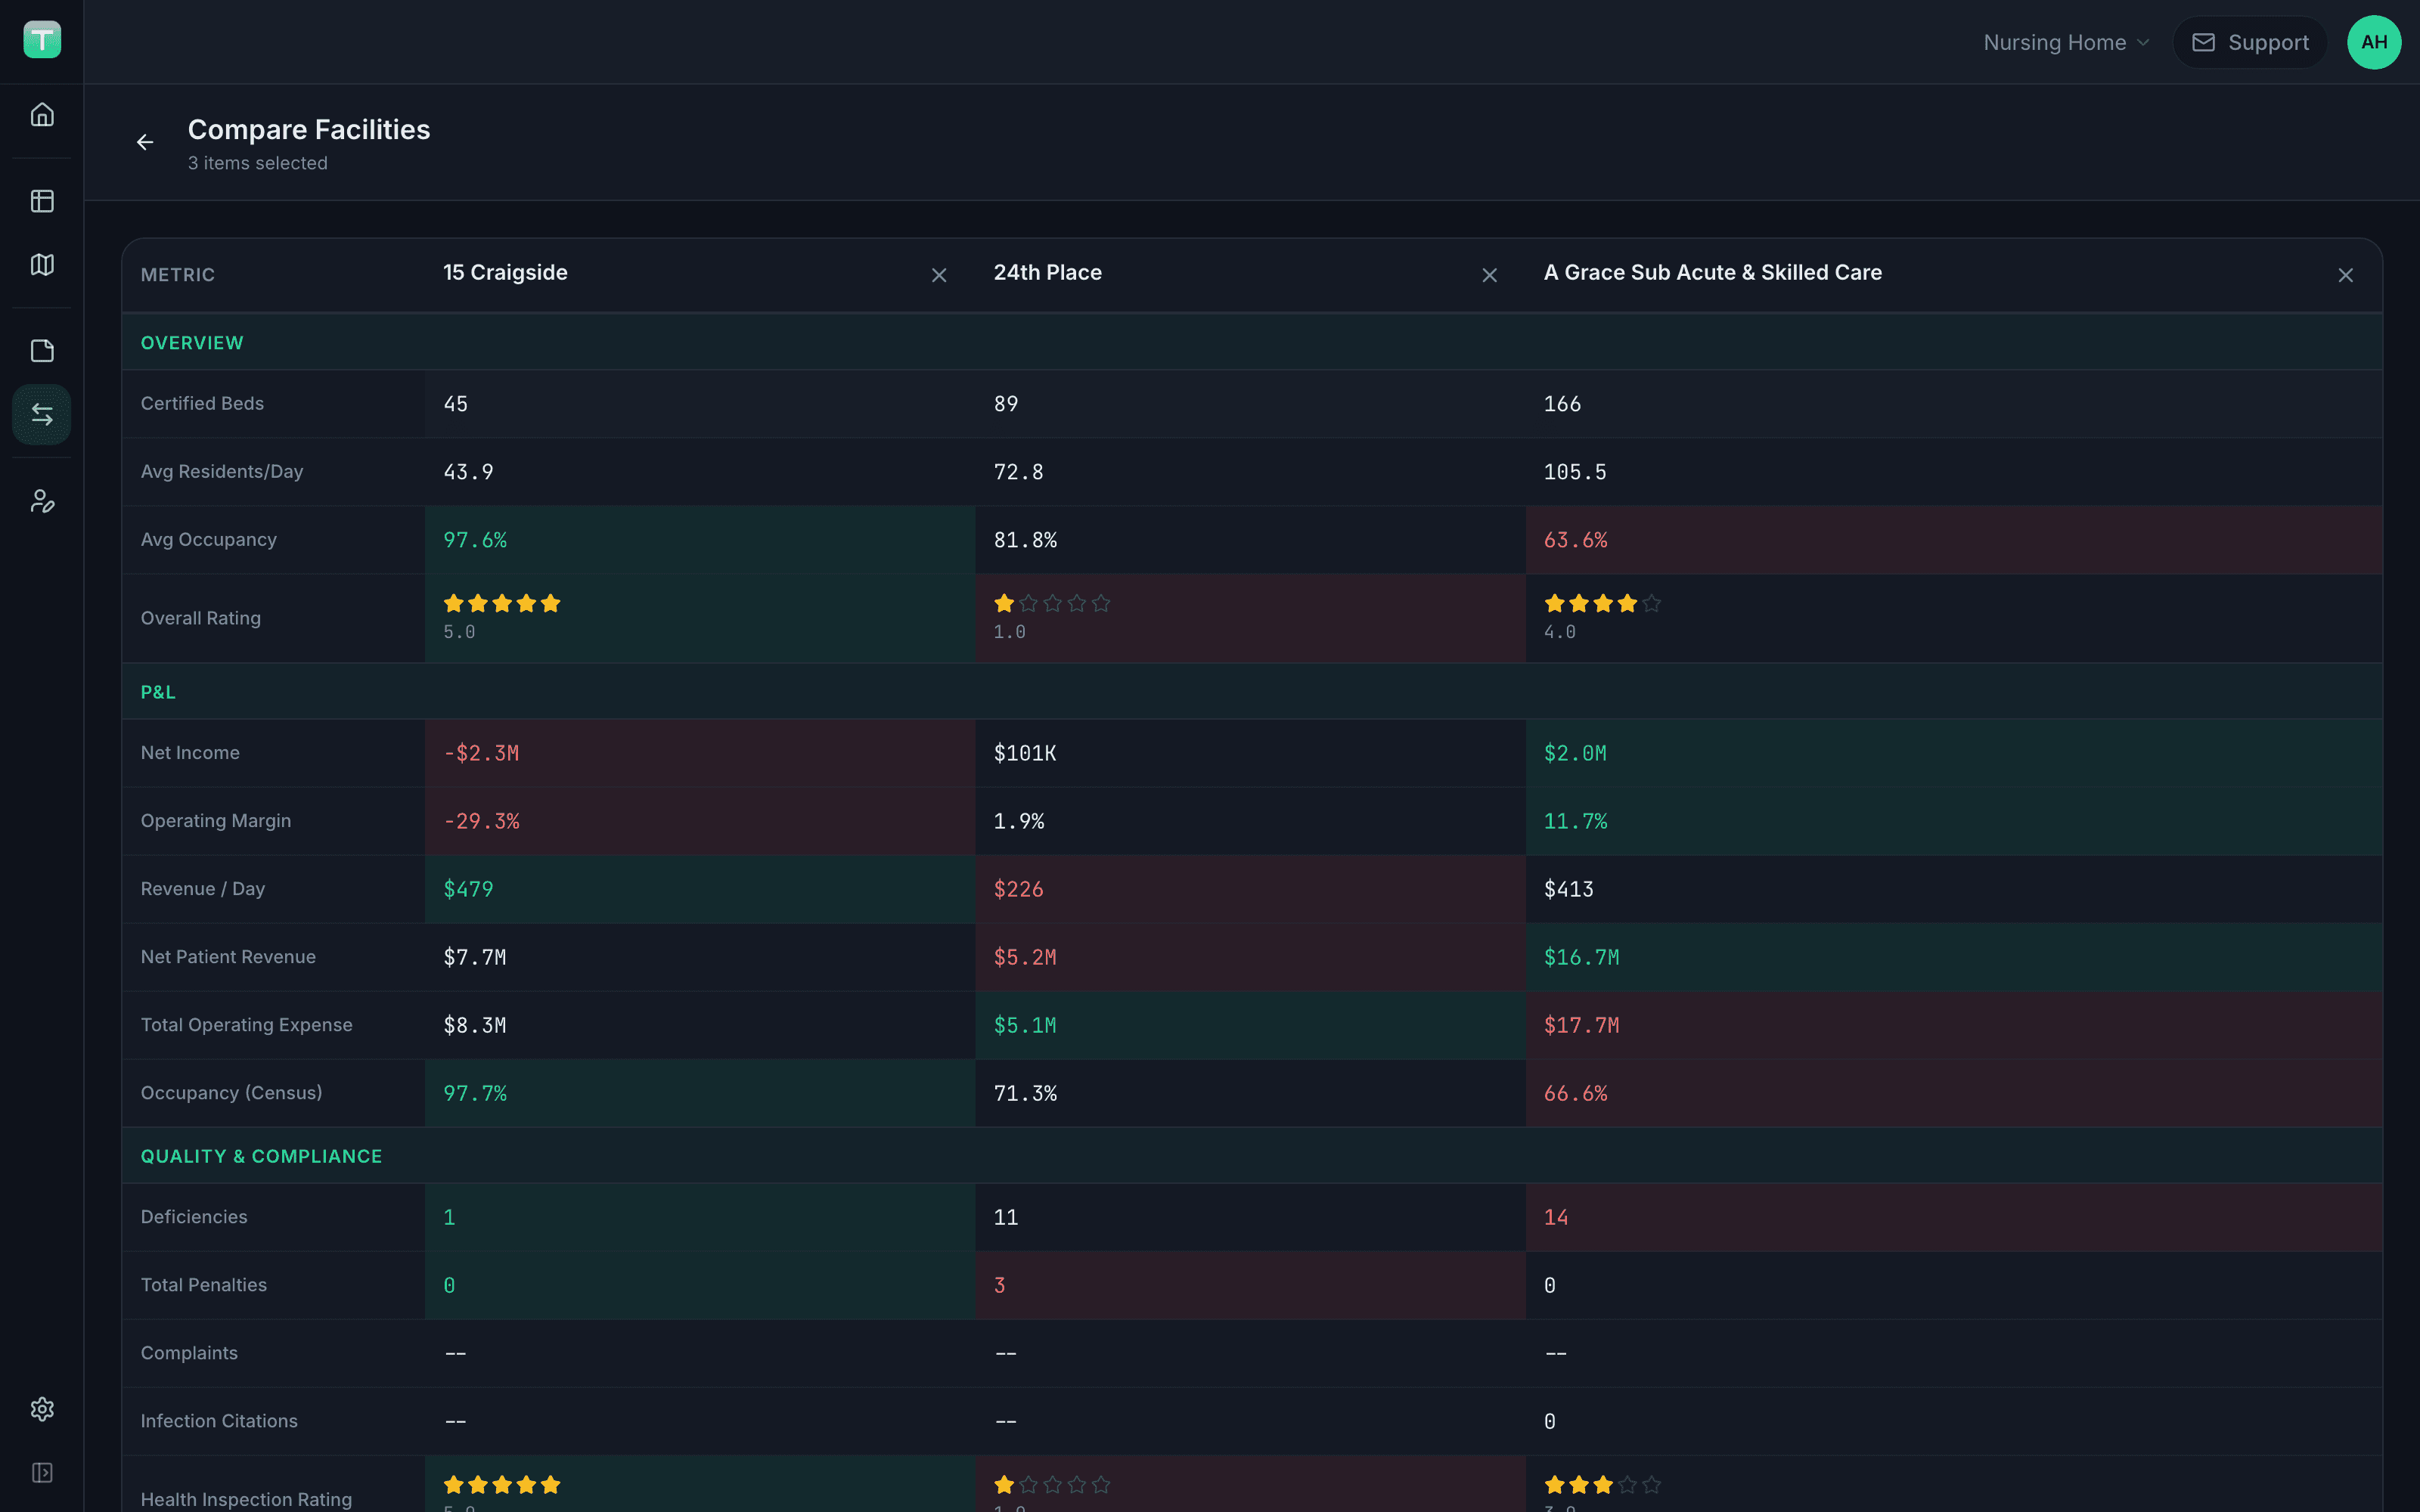
Put facilities side by side — winners in green, risks in red
Select any facilities, chains, or owners and compare them across occupancy, ratings, P&L, deficiencies, and penalties. Best-in-row and worst-in-row are heat-colored automatically, so the story jumps out of the table.
- Overview, P&L, and compliance in one matrix
- Automatic best/worst highlighting per metric
- Works at facility, chain, and owner level
Community-powered ownership data
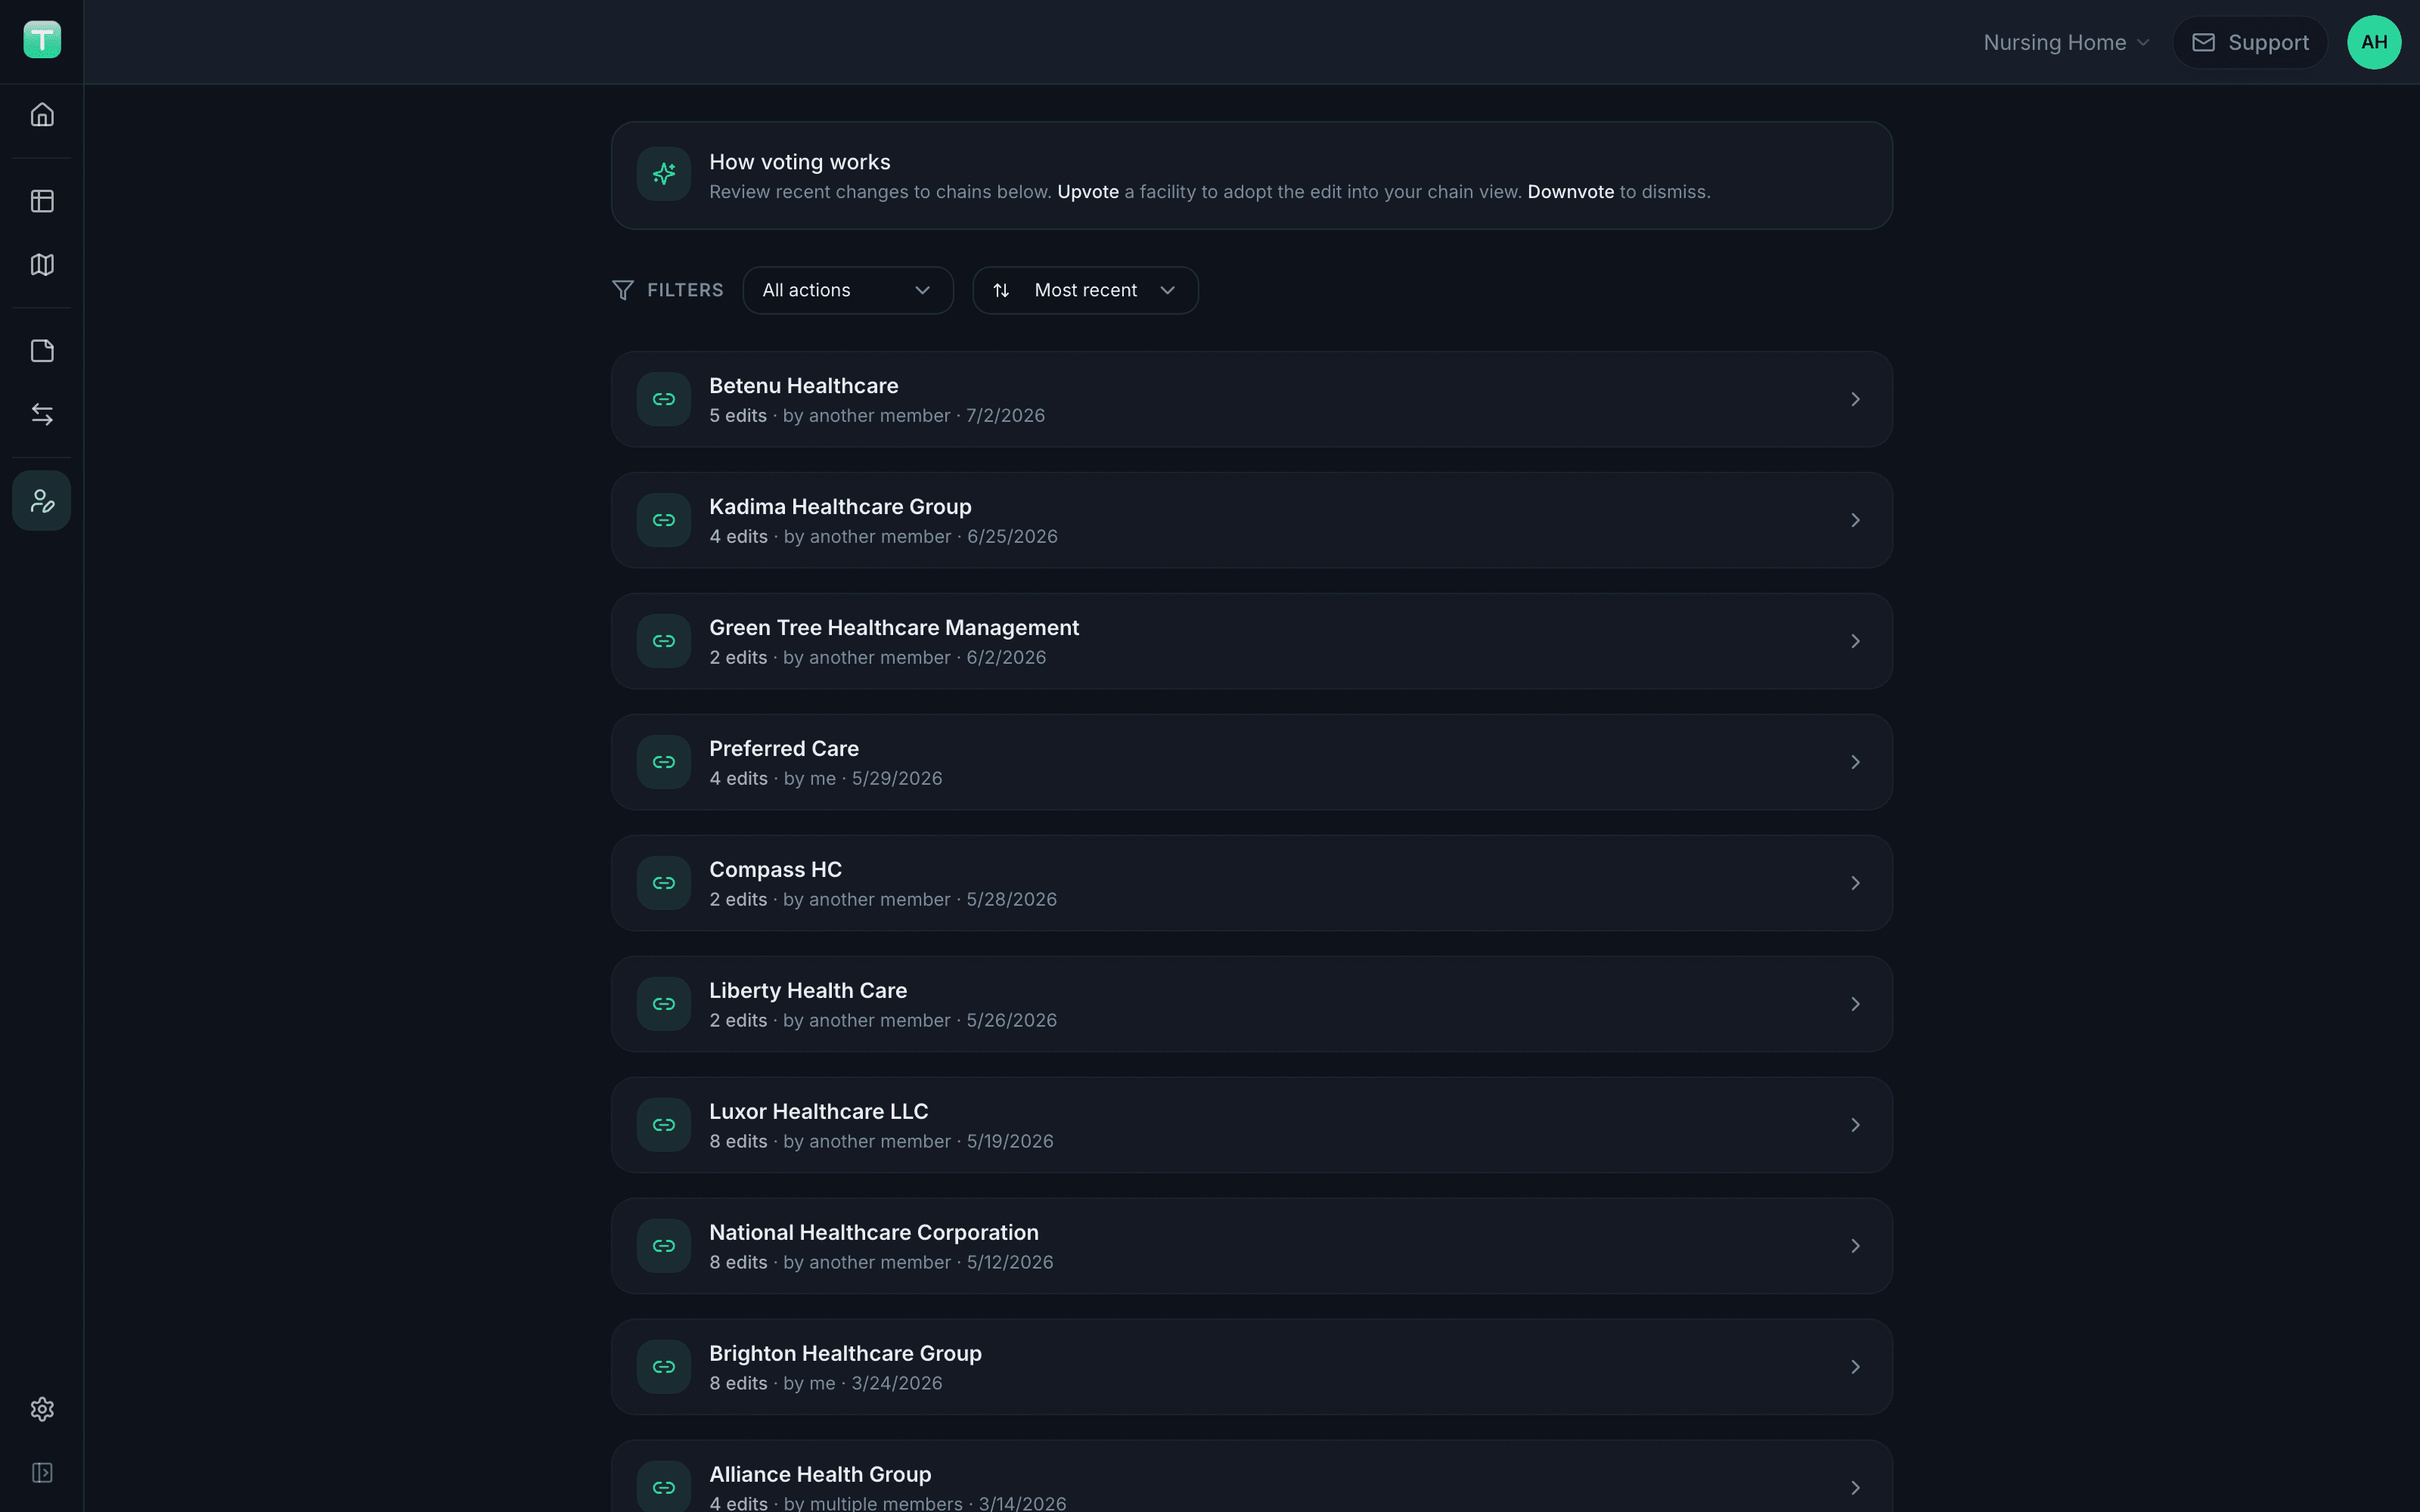
CMS ownership data can lag months behind reality. Corporate structures are buried in filings. Acquisitions go unreported. Tru-Optic fixes this by letting the people who know the industry keep the data current.
A user makes an update
CMS says Company ABC owns 5 facilities. You know they just acquired a sixth. Add it. That change becomes your default view immediately.
The community reviews it
Other users see the proposed change in their community feed. They review the update based on their own knowledge of the market.
Vote up or down
Vote up and the update becomes your default too. Vote down and it's ignored for you. The best data rises to the top.
Ownership data kept current by the people who actually work in the industry — not just annual filings.
How It Works
From question to answer in minutes
No training required. No complex queries. Just the facility intelligence you need, when you need it.
Search
Enter a location, draw a radius, or search by name. Filter by ratings, bed count, ownership, staffing, and more.
Analyze
Explore facility profiles with quality, staffing, compliance, financials, and ownership data. Compare facilities side by side on the map, in tables, or head-to-head.
Monitor
Tag facilities, add notes, and track the metrics that matter to your work. Stay on top of changes in quality, ownership, and compliance across your portfolio.
Who It's For
Built for healthcare professionals who need answers
Whether you're evaluating a single facility or analyzing an entire market, Tru-Optic gives you the data and tools to move faster.
Healthcare Consultants
Research markets and benchmark facilities for your clients. Build competitive analyses in minutes instead of days.
Investment Firms
Evaluate acquisition targets with comprehensive facility data. Quality ratings, P&L financials, staffing, and compliance history — all in one profile.
Compliance Teams
Monitor quality ratings, deficiencies, and regulatory risk across your portfolio. Spot problems before they become penalties.
Market Researchers
Analyze facility landscapes across states, counties, and ownership groups. Uncover market dynamics that drive better decisions.
Frequently asked questions
Have a different question? Reach out and we'll be happy to help.
Tru-Optic pulls from CMS (Centers for Medicare & Medicaid Services) public data, including quality ratings, staffing metrics, ownership records, compliance history, and cost report financials. Data is updated regularly to reflect the latest CMS releases — and ownership data is kept current by the community.
Care Compare is a consumer tool. Tru-Optic is built for professionals. We combine the same CMS data with facility P&L financials, interactive mapping, side-by-side comparison, ownership intelligence, custom tagging, and CSV export — purpose-built for consultants, investors, and compliance teams.
Yes. Every facility profile includes a full P&L from cost report filings: revenue, payer rates, salaries and wages, overhead, census and payer mix, and a balance sheet view — with every line benchmarked against the state median and ranked by percentile.
Sign up at app.tru-optic.com and you'll get a 14-day free trial with full access to the platform. After the trial it's $25/mo — no contracts, cancel anytime.
Yes. Your searches, tags, notes, and saved views are private to your account. We never share your usage data with third parties.
Tru-Optic currently covers skilled nursing facilities (SNFs) and nursing homes across all 50 states. We track over 14,700 facilities with 60+ data points each.
No. Tru-Optic is a web application that runs in your browser. No downloads, no plugins, no IT department required.
See every facility. Know every number.
14,700+ facilities. 60+ CMS metrics. Full P&L financials. Search, analyze, and monitor every nursing home in America.
Then $25/mo · No contracts · Cancel anytime