Financials
The full P&L behind every nursing home
Star ratings tell you about the care. Cost reports tell you about the business. Tru-Optic turns every facility's cost report filing into a readable P&L — for all 14,700+ facilities in America.
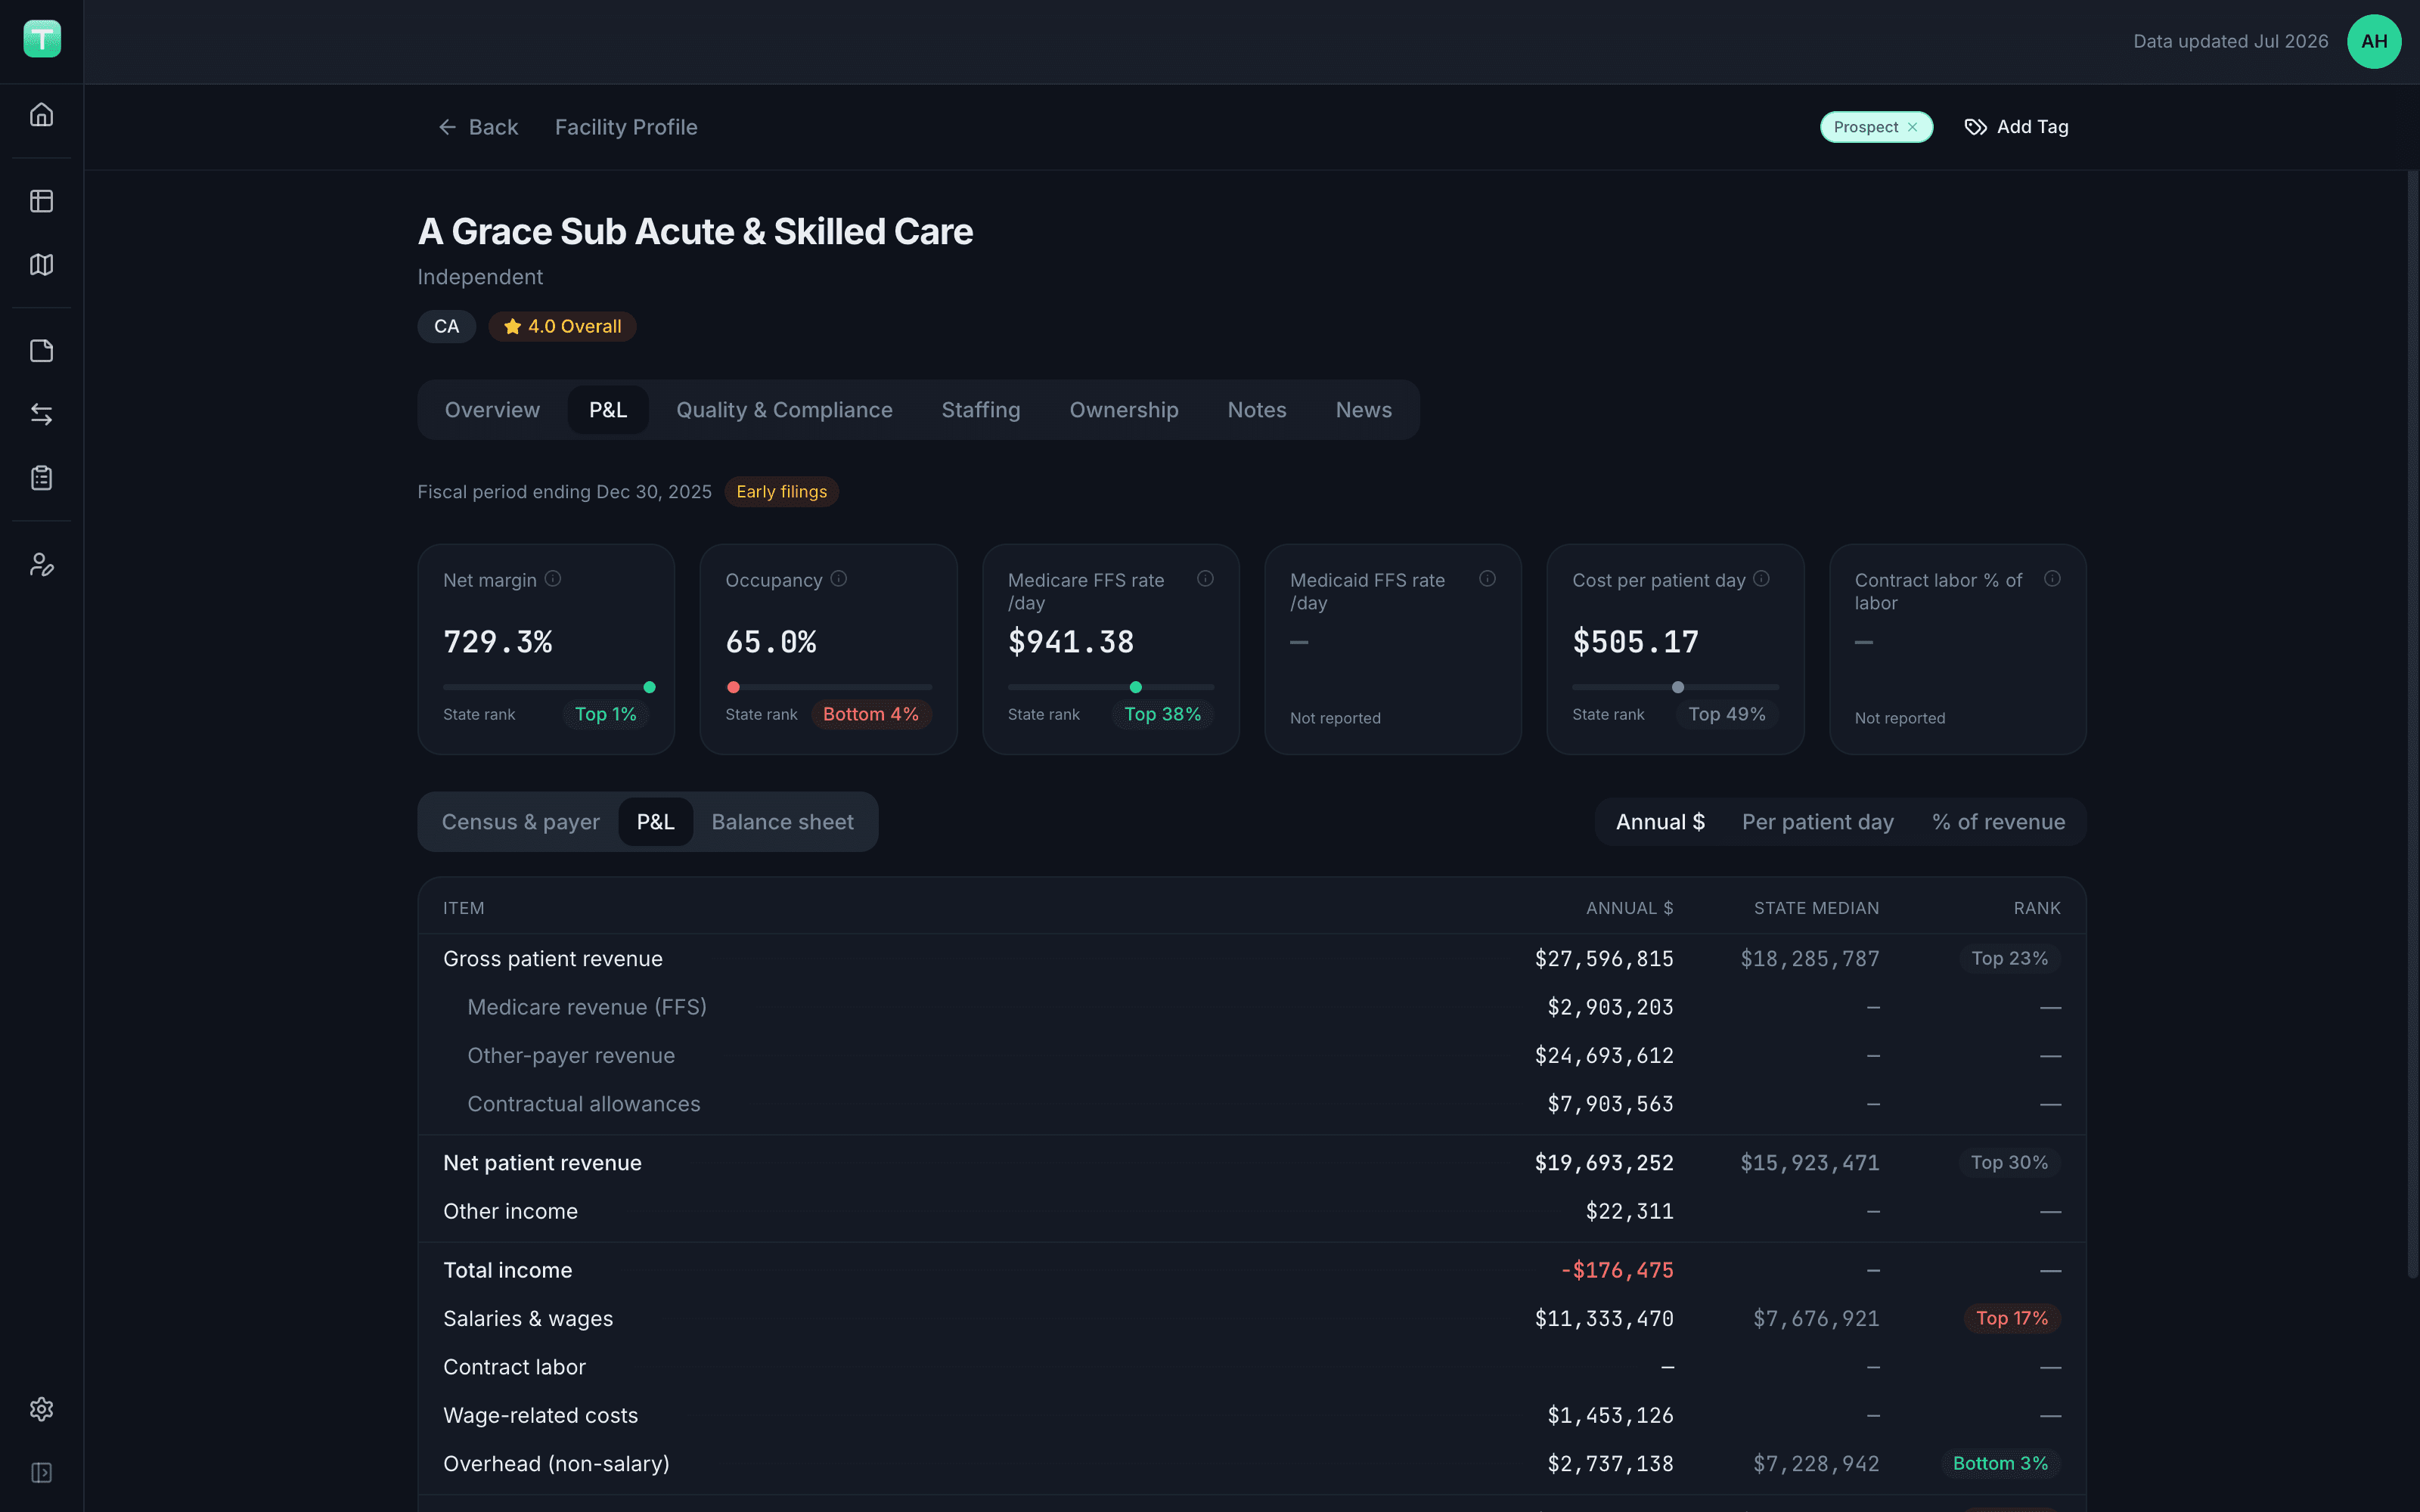
Cost reports, without the spelunking
Facility cost reports are public, but they're buried in filings most people never open — hundreds of pages of worksheets per facility, per year. Tru-Optic extracts the numbers that matter and presents them as a clean P&L on every facility profile.
Because the same structure exists for every facility, you can compare the economics of any two buildings — or any two chains — side by side, with best and worst performers highlighted automatically.
- Net margin, occupancy, and payer rates at a glance
- Every line benchmarked against the state median with a percentile rank
- Census & payer detail: patient days, discharges, Medicare and Medicaid mix
- Full P&L: revenue, contractual allowances, salaries, and overhead
- Balance sheet view alongside the income statement
Investment firms
Screen acquisition targets by operating margin and payer mix before you ever request a data room.
Consultants
Benchmark a client's facility against local competitors' financials in minutes, not days of cost-report spelunking.
Operators & compliance teams
See how the facilities you monitor perform financially alongside their quality and staffing metrics.
See every facility. Know every number.
14,700+ facilities. 60+ CMS metrics. Full P&L financials. Search, analyze, and monitor every nursing home in America.
Then $25/mo · No contracts · Cancel anytime